
Done
DONE Unsub Contabo VPS due to unused
DONE Continue Cross-Model Calculation
- This may not be a good timing to do this. Should wait for the docs revamping project being in progress more than now (as of #2026-01-03 ).
DONE Review AI sharing dashboard for Aurora
- Timeline:
- Aurora’s request came in via support. Phuong (AI team) looped in the data team.
- Hieu investigated and found AI data lives in ClickHouse (logs +
user_idonly), NOT the production DB. This means user-friendly info (names, emails) and dashboard/dataset-level tracking aren’t directly available. - Tien (AI team) confirmed: user_id mapping is possible via prod DB, token usage exists in HOtel, but dashboard/dataset AI activity tracking is hard.
- Triet advised: only answer what’s currently feasible, treat the rest as feature requests.
- Hieu drafted a reply to Aurora listing what’s available (conversation ID, user ID, messages, token usage) and limitations (no usernames, no asset tracking, only MCP data).
- Aurora accepted — said
user_idis fine, they’ll map it themselves. - Hieu built a dashboard at https://us.holistics.io/dashboards/v4/1099511684352-aurora-ai-conversations and proposed Google Sheets delivery. Aurora also suggested S3 export as an alternative.
- Nam asked Hieu to wait before sharing — he wanted to discuss commercially first.
- Nam proposed turning this into a paid upsell package at $10,200/year (“Usage and AI Data Monitoring Transfer”).
- Chinh (me) reviewed and said the data is feasible to share as spreadsheet, but noted Hieu’s dashboard is not ready to consume right now.
- Chinh and Phuong questioned charging for AI usage data since the AI team is already building an in-app AI usage monitoring dashboard for all customers.
- Vincent (CEO) clarified the monetization rationale: the in-app dashboard is free for all; what’s being sold is data sync/export to their own systems (S3/ETL). This targets enterprise needs: compliance, security auditing, long retention (7+ years), and custom analytics.
- Triet and Vincent discussed delivery method — S3 vs Google Sheets vs ETL to their data warehouse. Vincent prefers S3 since Aurora mentioned it and it’s more scalable for a paid add-on.
- For myself (data team):
- Data source: AI conversation data is in ClickHouse (not prod DB). It has: conversation timestamps, conversation IDs, user IDs, messages (prompts + replies), token usage. User info (email/name) requires joining with a production DB mapping table.
- Dashboard exists: Hieu built a dashboard at us.holistics.io/dashboards/v4/1099511684352 but currently not ready to share now.
- NOTE I need to review the data in dashboard. But not now. Let’s wait for Aurora’s response and the team initialize a project about this. Not sure who will be main owner btw.
- Prior art: I did similar work for SweetSpot before: https://holistics.slack.com/archives/C09GURCKQV8/p1772181645114809?thread_ts=1770132838.858979&cid=C09GURCKQV8
- Delivery format is undecided: The current preference is S3 export (Aurora offered to share an S3 bucket). Google Sheets with scheduled delivery was the original plan because we can reuse the Google Sheets Delivery feature. Final decision pending Nam’s email to Aurora.
- This is now a paid add-on ($10,200/year) — so quality and reliability matter. It’s not ad-hoc anymore.
- Scope boundaries: Only provide what’s currently available. Don’t try to solve missing data (dashboard/dataset AI activity, feature-specific breakdown beyond MCP). The AI team will build in-app monitoring separately.
- Stakeholders: Nam (commercial timing), Chinh (me) (data review/quality), and Phuong/Tien/Dat (AI team).
- Timeline:
((69bcb599-a91e-49ea-bc3d-6a5a651f03df))
DONE Project retro with team (Dong)
- Wait for the deal to win. Depend on Simon’s side. Update: Vincent has followed up with him as of [[2026-04-14]]: https://holistics.slack.com/archives/C08PRBTS1LK/p1774406326075359.
- Add2Cart won’t engage. Mark this task done.
DONE Consider a Flashcard app for learning new English words
DONE Document ((69670f5e-6da7-4bea-93ea-e42c9b94f574))
DONE Set up github repo and prepare documents inside it
DONE Oat milk machine?
DONE Consider a Flashcard app for learning new English words (mochi.cards)
DONE Setup linear CLI and agent skill for it
CANCELED Document [[Medenterprises]]’s performance use case, about how would our Metrics Sheet can learn from that
DONE Add linear cli to review current backlog tasks on linear
- Amp told me to use
schpet/linear-cli. Will try. Installing the skill is easy.
- Amp told me to use
DONE Clean up Arc tabs
Project: [[Personal]] Priority: #P3
DONE Feedback - request an UI for Query Model Persistence
DONE Learn how to query logseq blocks, create a cli tool or similar for agents to do it quickly
- Figured it out, logseq block has pattern
((uuid)). Just let the agent grep it, no need complex tool.
- Figured it out, logseq block has pattern
DONE Add tabs to Hooli dashboard - write solution proposal
DONE Self-host postgres inside contabo intead of using neon.tech
DONE Consolidate drill-through dashboards into 1 single dashboard
DONE Editorial on a data support document to publish and note down frictions
- When a data member supports a ticket, in general here are input and output.
- Input
- Use case: I want to achieve this … here is the current set up … (I already do this but it’s not working).
- Customer’s environment: data (stored in database) + AML assets (models, datasets, dashboards).
- Output:
- Environment decoupled from customer specifically: generalized AML assets + fake data.
- Solution: AMQL modeling, data result.
- Document: how to do it.
- Example document (A/B comparison dashboard):
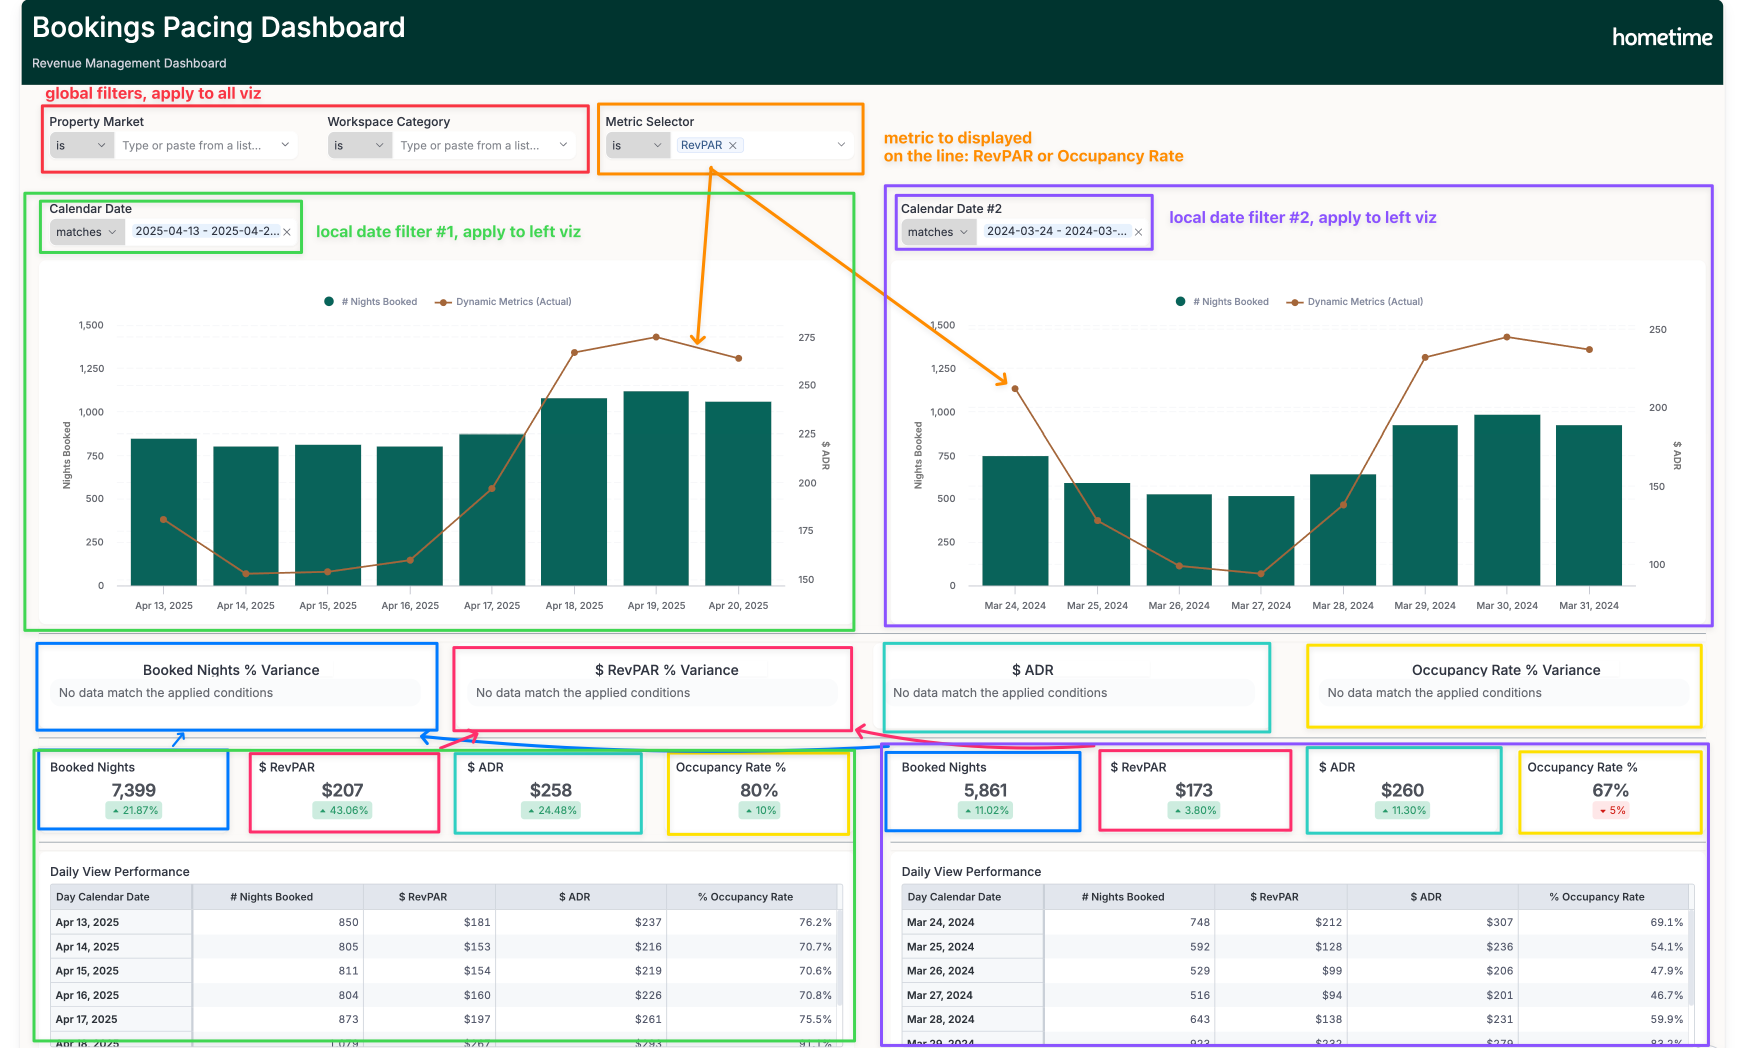
- Use case: The user want to create a dashboard for A/B comparison. The user can input 2 independent date ranges then the dashboard automatically calculates the corresponding left/right charts.
- Input
- A simple star schema dataset: 1 fact model + 1 dim date model + other dims for break down. Visualized in dbdiagram.
- Metrics:
booked_nights,occupancy_rate - Data: Booking data (Hometime, similar to AirBnB).
- Expected result: https://media.secondbrain.lelouvincx.com/2026/01/43c09a8ac07132a85d2ca8b90ce2a865.png
- Output:
- A functional dashboard as expected: when the user can input 2 independent date filters and the dashboard automatically calculates the corresponding left/right charts.
- Left Area (green annotated): Charts listen to
Date Filter 1. - Right Area (purple annotated): Charts listen to
Date Filter 2. - Middle Area: Needs to listen to both
Date Filter 1andDate Filter 2simultaneously to compute variance of metrics. - Modeling setup:
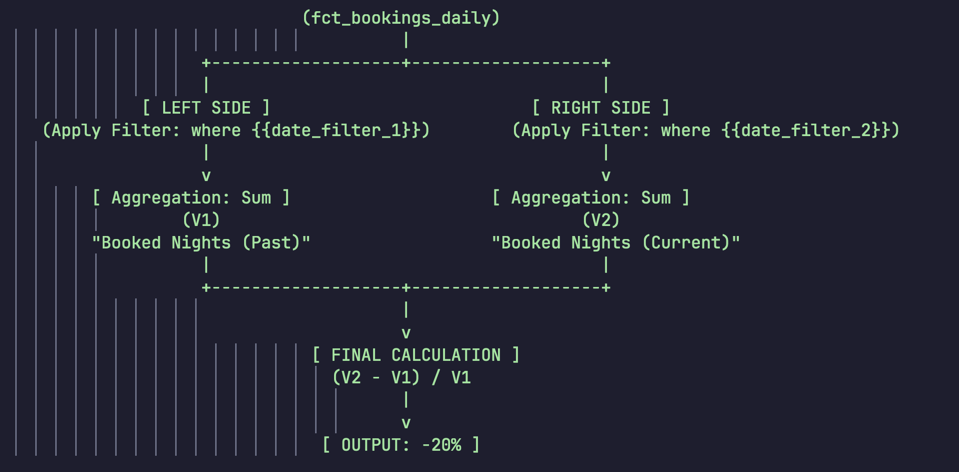
- High-level mechanism: https://media.secondbrain.lelouvincx.com/2026/01/723d8237f45853398d51996bbd071f5d.png
- The modeling structure keeps the same, changes are in param and metric definitions.
- Add 2 date params to control input
- For each metric, starting from base definition, derive to 2 metrics, each controlled by one param.
metric_date_param_1 = metric | where(dim_date.date matches (date_param_1 | first())
- Fake data: choose our ecommerce demo dataset to demo. Generate ascii as temporary example.
- Frictions
- How to replicate AML assets and data.
- Not every tickets can be published as analytical use case, some are docs/feature limitation, some are in backlog.
DONE Think about solution ID-based mapping
DONE Data support for Aurora, impersonate into their trial tenant and install data
- I realized the dataset Phuong demoed (staging2) is different from the demo dataset
demo_ecommerce_version_2. - AI how-to questions:
- Slack: Restrict usage of the AI as a whole for certain users. For example data users want to test and put context in before publish it to business users.
- Example questions:
- How is the monthly sales going from 2025 to now?
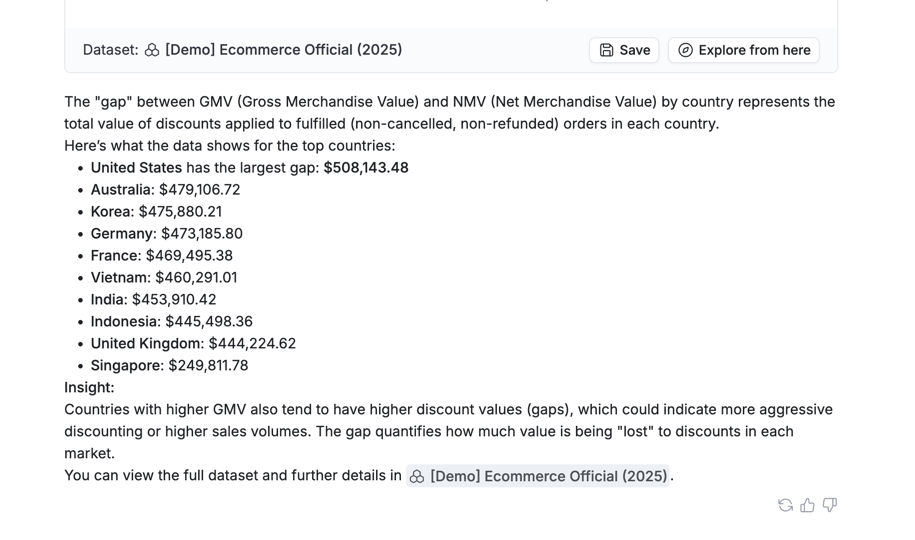
- The GMV is up, but are we actually making more money?
- Which product categories generate the highest GMV?
- Which merchants offer the highest discounts?
- How does revenue vary by country or merchant?
- Which customer segments have the highest AOV?
- Which customer segments should we target to maximize repeat purchase rate? Should explain like age_group × gender × country vs total_repeated_buyers
- Which merchants are trending toward high cancellation rates before it becomes a problem?
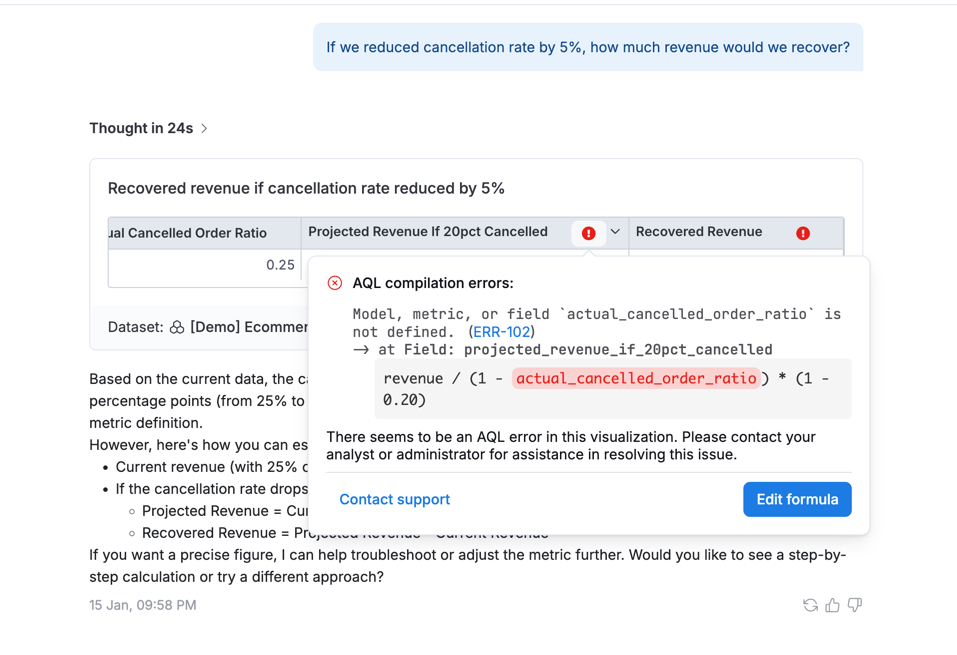
- If we reduced cancellation rate by 5%, how much revenue would we recover?
- How is the monthly sales going from 2025 to now?
- User custom profiles:
- A user who only wish to view data in table, no other chart types.
- My feedbacks:
- Render DBML as explaination for AQL writing.
- When I’m interested in an answer, I want to save it to my personal workspace. It would be very interesting if the saved result is not only the chart, but also the narrative from the conversation. Because the chat history can be lost in the future.
- Ability to persist the viz type in chat after changing it.
- Explaining the result should give precise examples.
- Remember the explore fstate for later displaying to users. Example: You can review the full details and trends for all merchants here: View in Holistics.
- Route specific group of questions to a specific group of datasets.
- For a specific group of users they want the answers to fit their tone. For example, CEO wants numbers and explainable insights, data wants data charts and calculation logic behind.
- If running into an error, I want a CTA to report bug to my data team (e.g., chat link)
- Line spacing may be too narrow?
- I realized the dataset Phuong demoed (staging2) is different from the demo dataset
DONE Check a Vu’s recommendation on dynamic markdown
DONE Devise the plan for performance optimization
DONE Learn Parquet Zone Maps
DONE Draft the strategy
- DONE Do a POC
DONE Set up the auto-upload to R2 for logseq
DONE Fix neovim
DONE Overall plan for the Olist project
DONE Share use case of Add2Cart’s Dynamic Markdown for a Vu to write docs Project: [[Add2Cart]] Priority: #P3
DONE Documentation for Dresslife’s use case
Project: [[Internal]] Priority: #P2
DONE Compose a hand-on project for Yen, part 1
Project: [[Teaching]] Priority: #P2
- Dataset: Brazillian Ecommerce
- DONE Prepare the data.duckdb file
DONE Prepare the dbdocs
DONE Tell a story about the business context
- Olist Office: https://youtu.be/iy5gJye8N-A?si=7_o9sInvRpVNvr-D
- Rio de Janeiro https://youtu.be/iNfEAJVVY10?si=TOQZDVYnWdjElQlf
- A day in life of a SWE in Rio de Janeiro https://www.youtube.com/results?search_query=a+day+in+life+of+software+engineer+in+rio+de+janeiro+
- DONE Phase 1: Get used to the business and the dataset by
- Virtually travel Rio de Janeiro
- Learn a day in life if work there
- Start the job, learn the business context
- Understand data schema
- Answer some basic questions in SQL
- Deliver a simple charts to answer some business questions
DONE Call Pencil Project: [[Presales]] Priority: #P1 Customer: Pencil
DONE Conceptual design then setup the S3 structure
Project: [[Add2Cart]] Priority: #P1
DONE Review MRR Financial Reporting
Project: [[Internal]] Priority: #P2
DONE Nói chuyện với Huy Đỗ về daily tasks của data team
Project: [[Weekathon 2025]] Priority: #P1
DONE Write messages for guiding performance optimization
Project: [[Duty Support]] Priority: #P1 Customer: Superbexperience
DONE Write market interaction of MOK Project: [[Presales]] Priority: #P2 Customer: MOK
DONE Feedback dynamic filter does not allow preview values Project: [[Internal]] Priority: #P3
DONE Data tracking for OpenAI
Project: [[Internal]] Priority: #P3
DONE Review S3 directory structure
Project: [[Add2Cart]] Priority: #P1
DONE Reply Natalia Jay
Project: [[Personal]] Priority: #P2