
Notes
- [[Presales]] try this exercise:
- Think of yourself as the sales person explaining how the feature works?
- How would you explain this diagram to someone?
- Where would you start? What does the flow look like?
- From there, see what kind of visuals would you add/modify to make the explanation smoother.
- LEARNING Claude Design is better than Google Stitch
- Observation: CD writes HTML code to design UI, while Google Stitch uses image generation.
- I personally prefer CD because I usually design conceptual diagram, which should be well-structured and easy to explain.
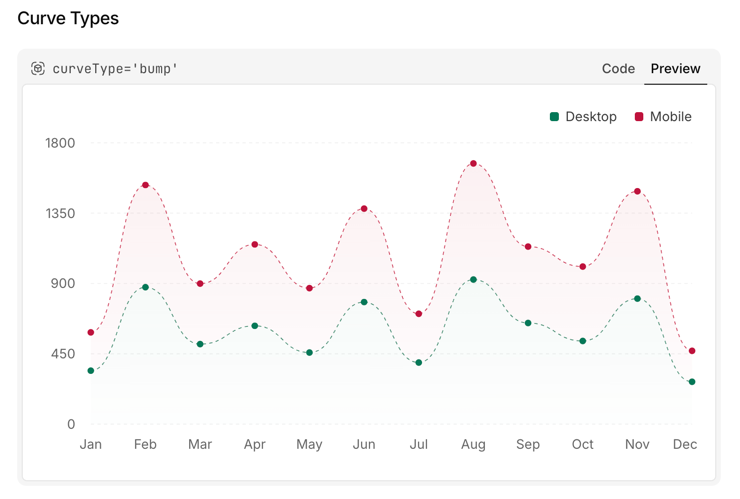
- This is super beautiful and usable: https://evilcharts.com/docs
- https://media.secondbrain.lelouvincx.com/2026/05/7904c74a3bfd586c80c40cb870a4476d.png
- [[Data Visualization]]
- Built with Recharts and Shadcn, I can think about reusing this for my [[Personal Finance]] website.
- https://playground.powerbi.com/en-us/showcases-gallery
- This site is very useful to reference to build Holistics own showcase.
Tasks
- TODO Feedback - Publish via CLI?
Partly today
Done
- ((6a060370-7309-47ce-ac65-019683656a94))