
Notes
https://waitbutwhy.com/2013/11/how-to-beat-procrastination.html
- https://media.secondbrain.lelouvincx.com/2026/04/60139e01b905173a831f0f02d07d6fbd.png
- Some quotes:
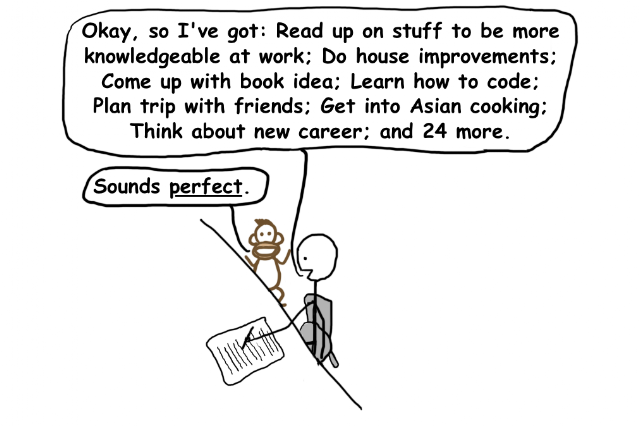
- “Procrastinators love planning. But when procrastinators plan, they like to do it in a vague way that doesn’t consider details or reality too closely, and their planning leaves them perfectly set up to not actually accomplish anything.”
- “Effective planning takes a big list and selects a winner.”
- The advice is right: long carry-over tasks often have a procrastination root, not a priority root. Indeed, there are some tasks like this. One of the reasons is it’s too vague, and I feel hard to get started.
- LEARNING For vague tasks, try time-blocking, try to deal with it, understand it and make it less vague.
https://opensource.posit.co/blog/2026-04-20_ggsql_alpha_release/
[[Data Visualization]]
Similar: ((69abe62c-fb13-405d-b952-c1e39a612780))
This is good. One of the use case I think about is the ease to embed into text-based documents like markdown or even an LLM-friendly chat. How similar it is to Mermaid.
If it goes with this direction I think would be very useful in term of quickly visualizing the chart, without:
- Setting up a complex BI tool.
- Bundle the heavy python/javascript environment.
Declarative enough syntax.
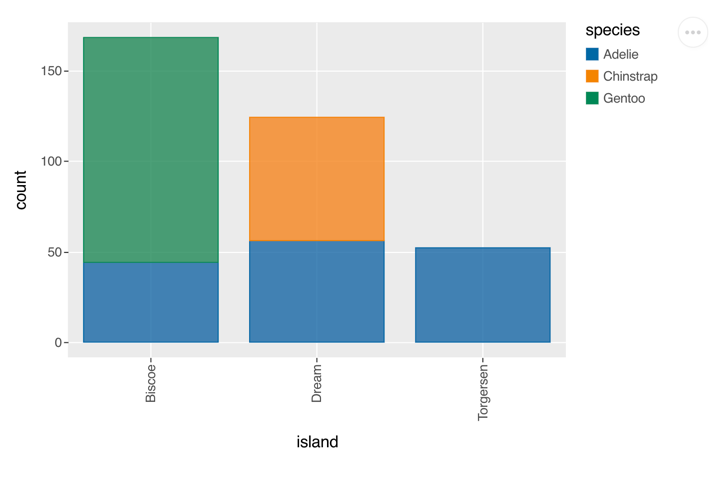
VISUALIZE island AS x, species AS color FROM ggsql:penguins
DRAW bar
https://media.secondbrain.lelouvincx.com/2026/04/a487a9276f7f1d0ea0f513931ad67665.png
https://newsletter.weskao.com/p/how-to-be-concise
- What is the most important thing to say?
Column-level lineage is moving from differentiator to table stakes
- Saw two posts back-to-back this week regarding column-level lineage that crystallized something for me.
- Column-level lineage used to be a competitive differentiator (dbt builds this for only cloud version). With coding agents, a single dev can ship a credible v1 over a weekend (example).
https://benn.substack.com/p/how-do-you-make-a-chart
- [[Vibe Analytics]]
- It’s the future of analytics, some say. There is no more visualization software. That’s what gets replaced. Don’t buy Tableau; instead, open Claude Code or Codex, and ask it to make a custom dashboard in JavaScript or Python. And that’s better than using dedicated charting tool, because with JavaScript or Python, you can build anything you want.
- We’ve talked about this a number of times before: The real future of analytics might not be analytics, but vibes:
- If AI is good at anything, it is good at interpreting the vibes. It is good at aggregating massive amounts of text—and increasingly, of video and audio—into its approximate average. Give it your support tickets and customer communications, and ask it questions about what it read. Don’t classify and categorize images; just ask an AI model what it thinks it sees,-as%20output%20FROM). … Ask it for the vibes.
Tasks
Partly today
Done
- DONE Install RTK rewrite hook