
Notes
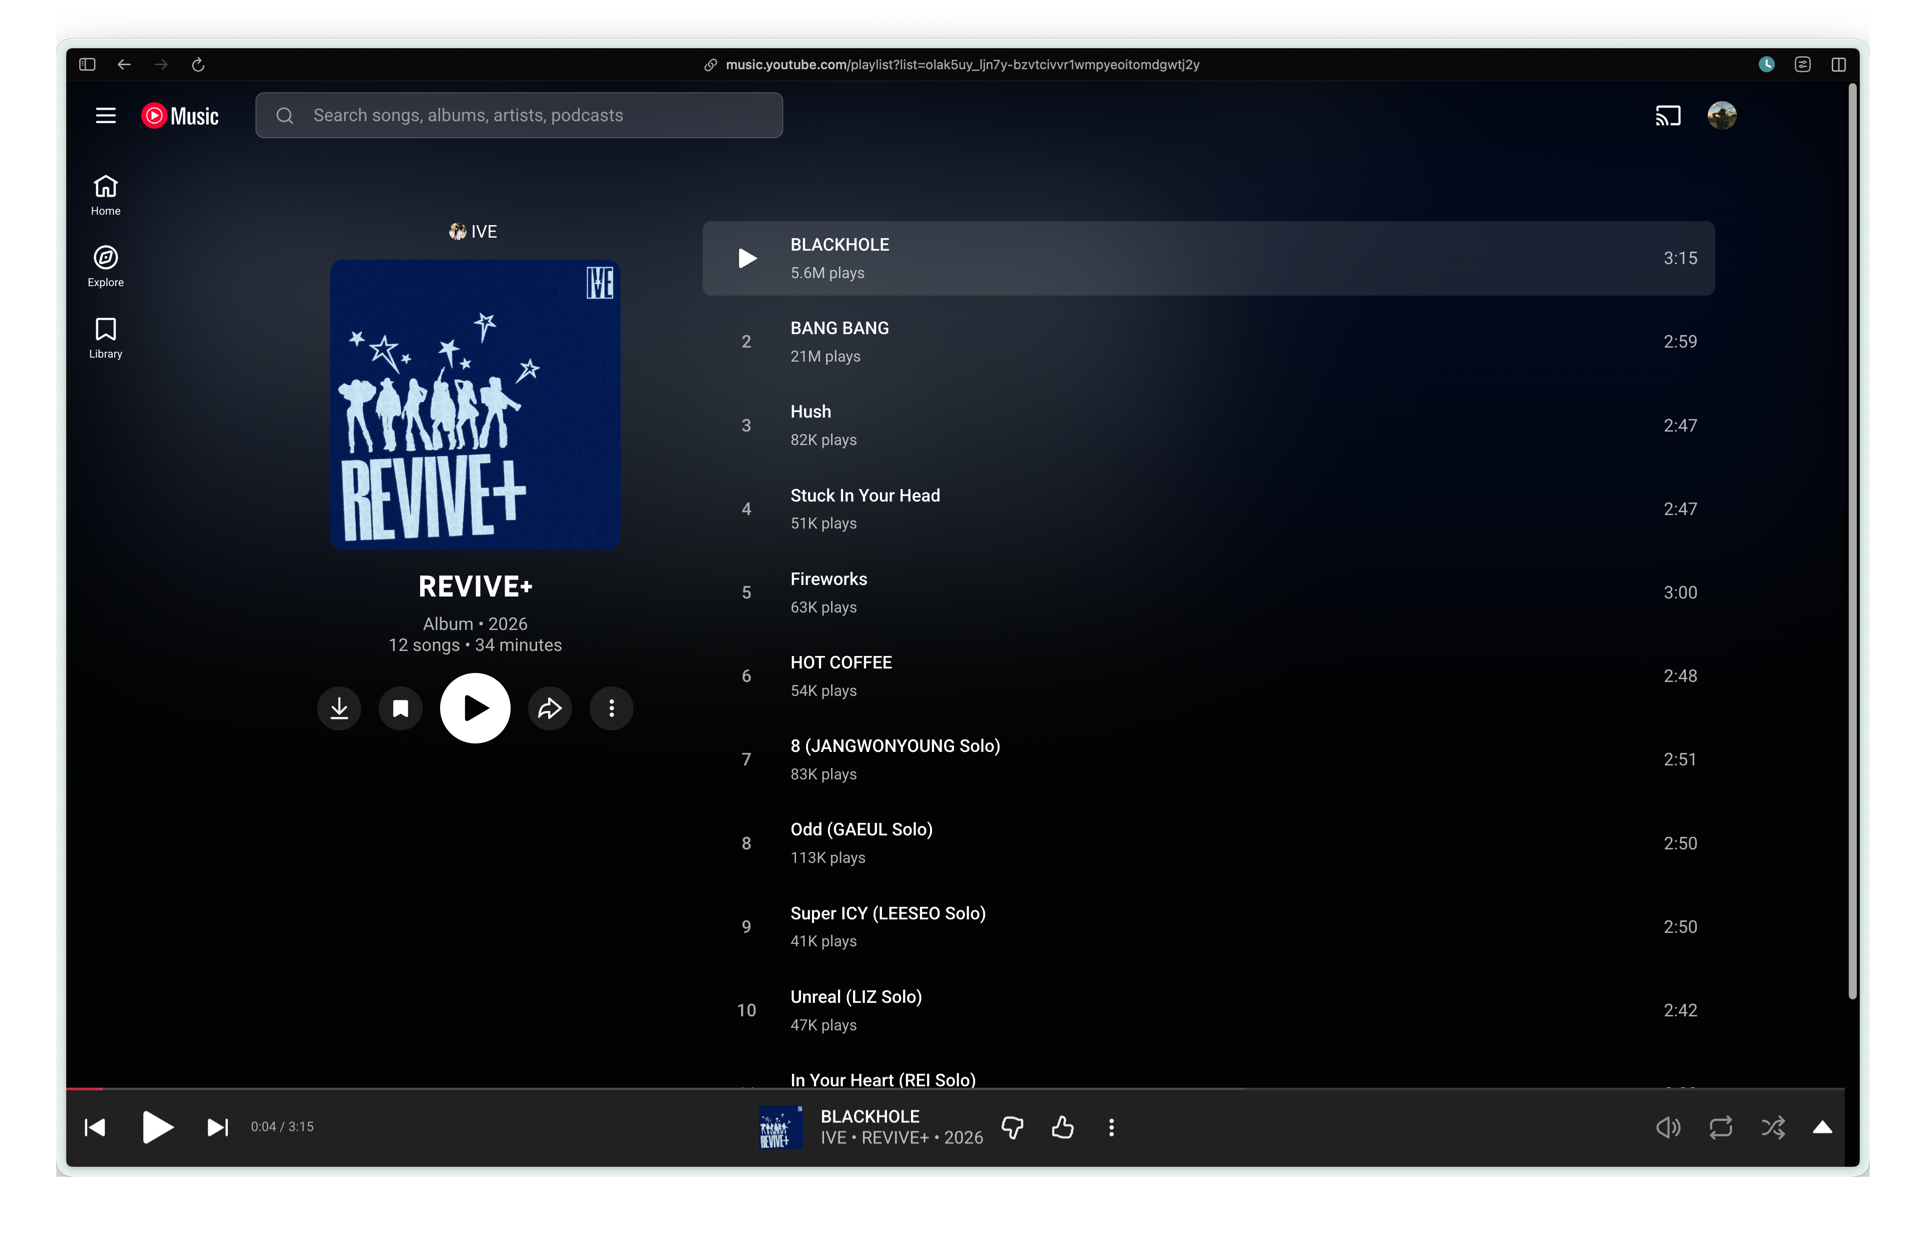
Back to work with IVE’s new album!
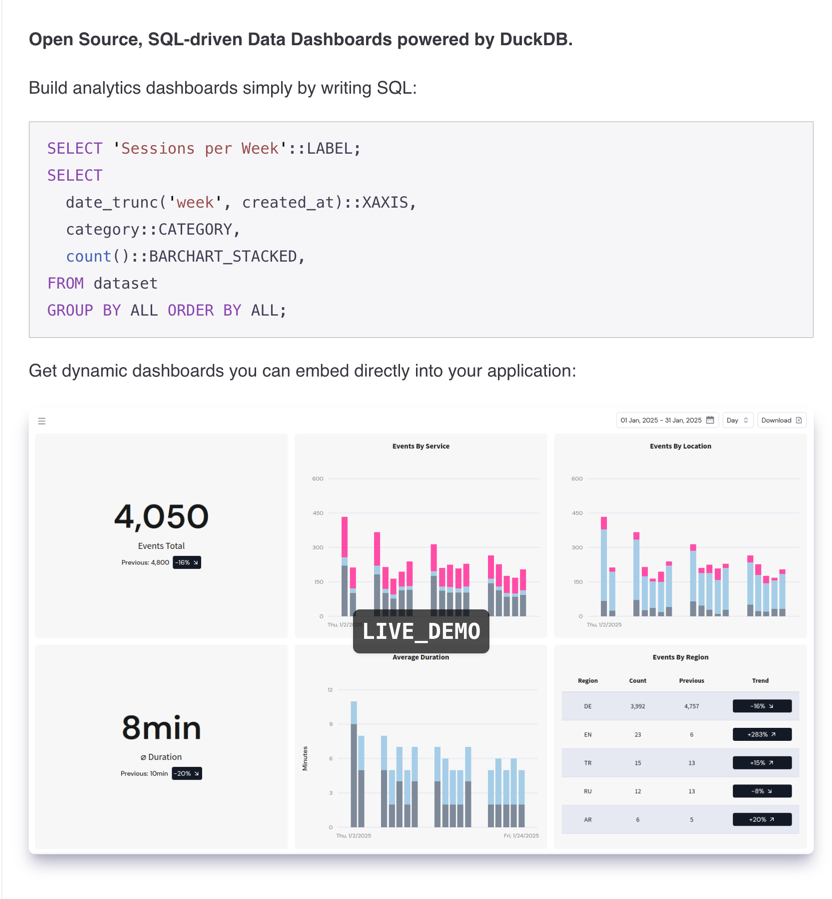
Found a dashboard as code solution Shaper
- [[Data Visualization]]
- Duckdb-first
- They unify charts as code by adding suffixes like
BARCHART,PIECHART, etc - Example code snippet:
SELECT 'Sessions per Week'::LABEL;
SELECT
  date_trunc('week', created_at)::XAXIS,
  category::CATEGORY,
  count()::BARCHART_STACKED,
FROM dataset
GROUP BY ALL ORDER BY ALL;
- Example
- But I’m worry about the development speed because there’s only 1 maintainer.
- And the flexibility of explore, like Holistics Explore Dataset. This is more suitable for static / few filters monitoring dashboards and can be used well for studying purpose.
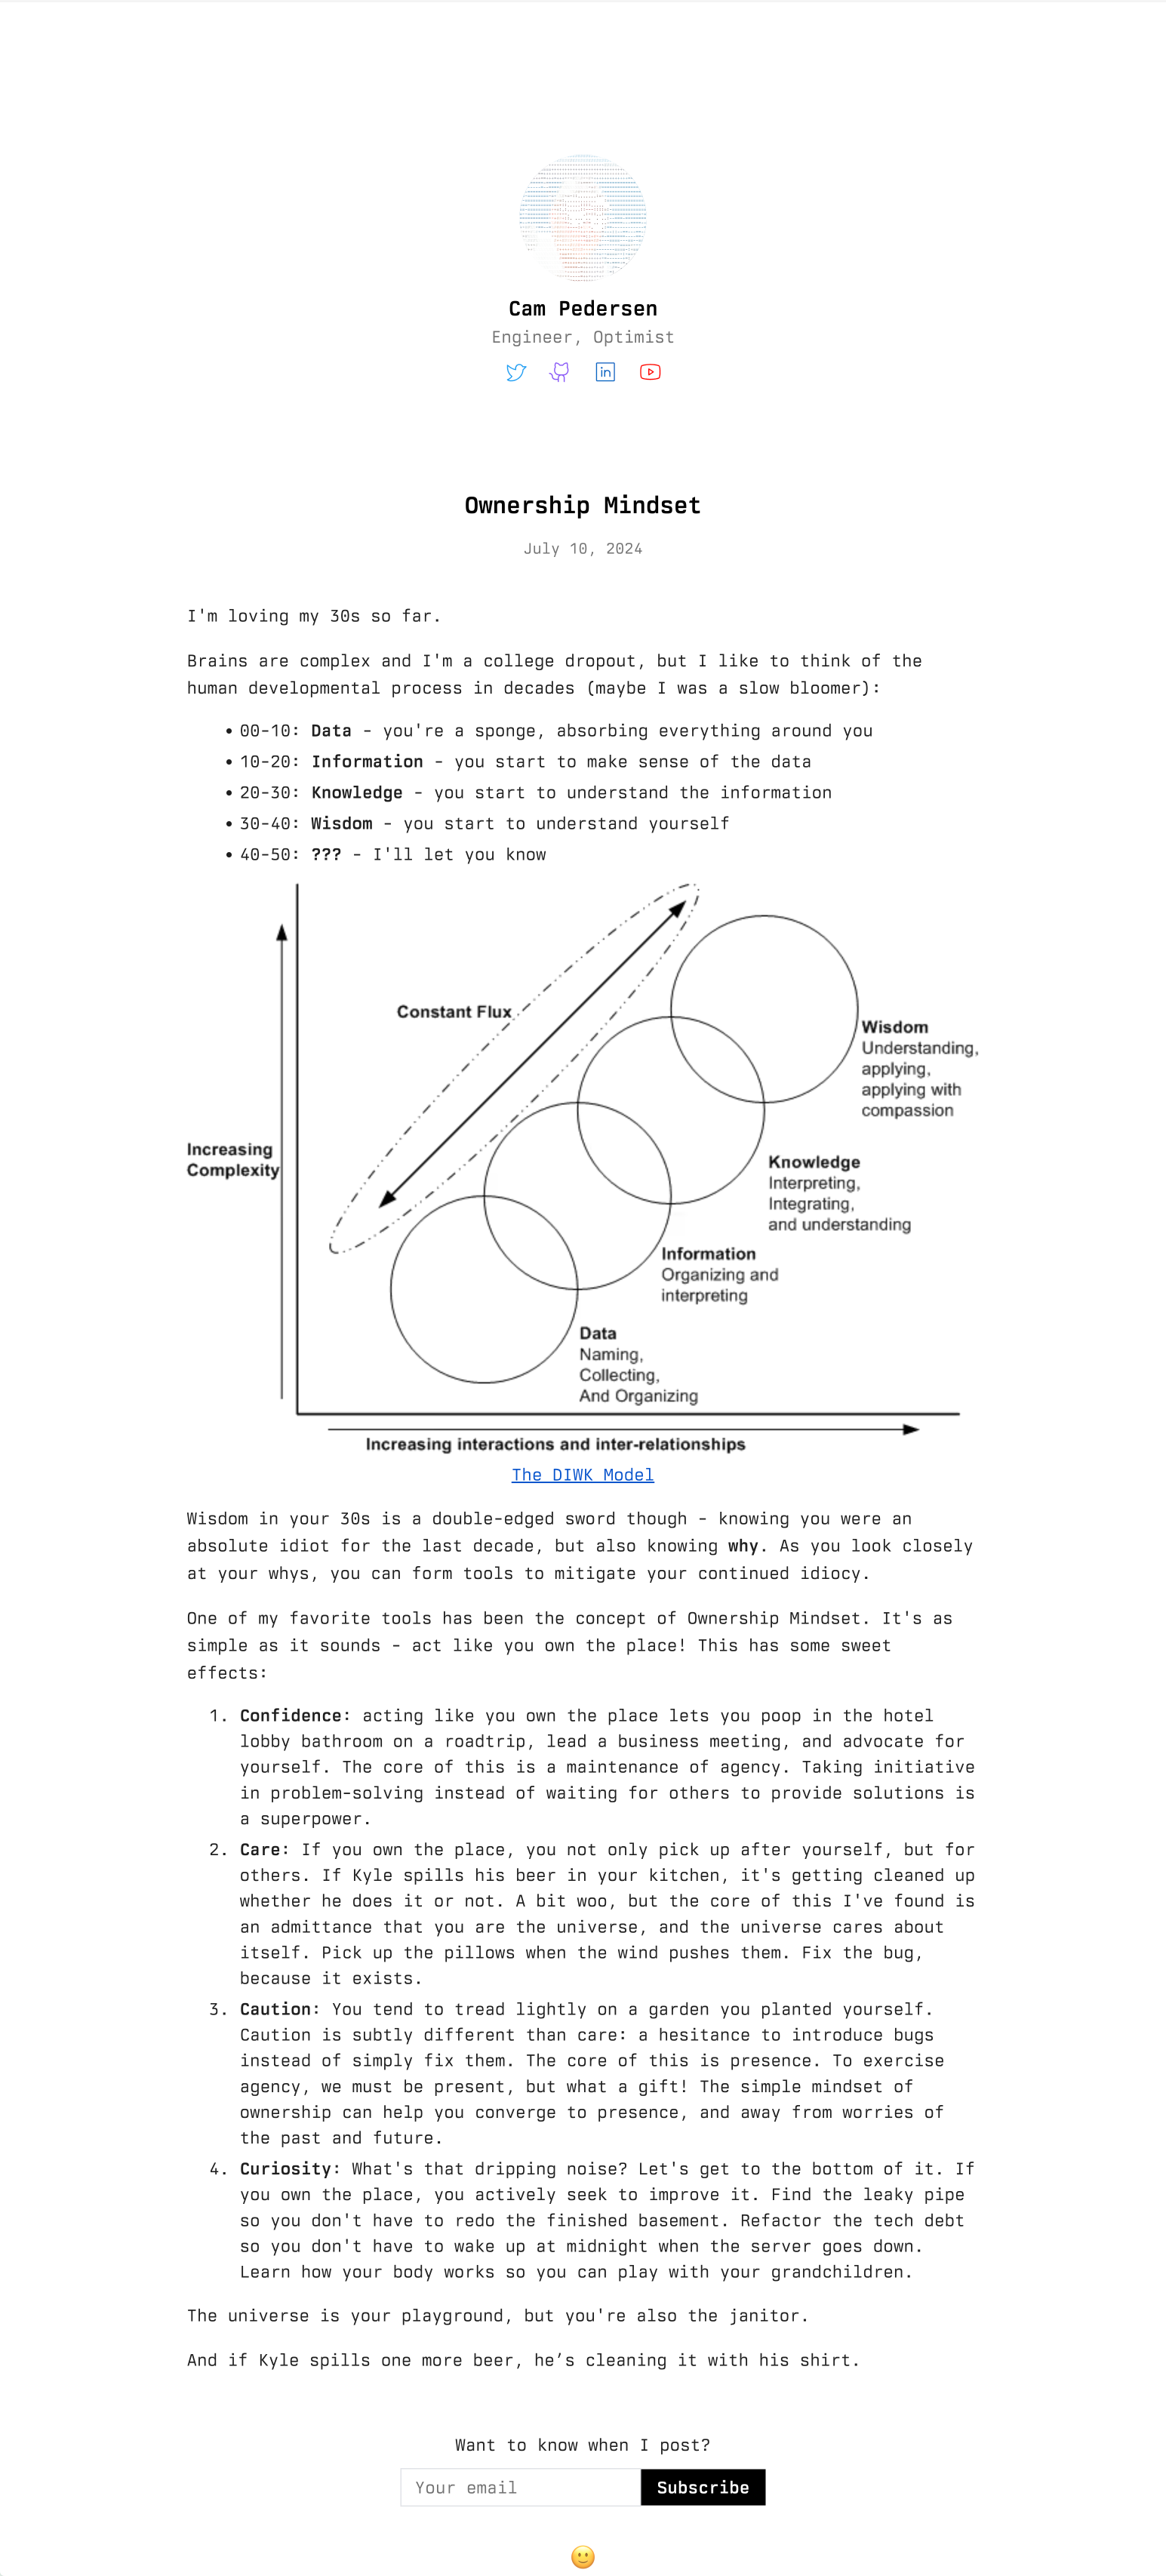
- Found a very cool blog: campedersen.com
The site is incredibly fast that I wonder how to create a similar site? (I went researching his github but seems nothing found).
There’s a fake terminal interface and it’s smooth too.
Favorite article: Ownership Mindset
- [[DIKW Pyramid]]
- Communicating with executives
- No teaching. The goal is alignment, not education.
- I experienced this some times talking with a Huy, when I started teaching, he lost attention.
- No hiding, prefer transparency. Hiding just delays the progress.
- Communicate with story-driven mindset: why it exists, what problem it solves, what impact it can create.
- If we listen carefully, we can immediately identify where we can contribute, rather than pitching generic solutions.
- Each conversation is an opportunity to refine skills.
- No teaching. The goal is alignment, not education.
Tasks
Done