
Notes
Small setting in MacOS but makes me happy: change color of highlighting to yellow, to make it more like a normal highlighter (default is blue).
Tasks
Done
- {{embed ((696e1a3b-3474-49a3-9604-c3a3eaf04c61))}}
- DONE Write peer review for colleagues
{{embed ((694b5e14-1dff-4e10-b325-ed0dae46e467))}}
DONE Colobbo’s use case
- “It may not be a good fit, it may not be a strong fit, whatever. But the point is, if you can’t support this guy, I don’t know if other tools can do it.”
- Most standard BI tools (Tableau, Power BI, Looker) are built on the assumption that 1 field = 1 database column. When you break the rule by storing columns into rows, tools fail because they cannot see the fields to filter or group by them without massive performance penalties.
- The best option is to make it hybrid, like headless BI. Because the UI is very difficult to replicate.
- Understanding
- Based on requirements there are 3 main parts:
- Users can add many filters (default/custom) simultaneously
- Run a query (can be either AQL - our internal query language or SQL)
- Grab the returned results and render table, with additional custom columns.
- 1st assessment: Holistics dashboard cannot allow users to add as many filters as they want -> this is known limitation -> the Embedding approach isn’t suitable now -> we can try to assess the Headless BI approach.
- Headless BI: The app render UI on its own, then post an API request to Holistics and receive resuilt, after receiving result it can render data table.
- Sample request payload (in AQL - internal query language):
explore {
  dimensions {
    sites.id,
    field_values.field_key,
    ...
  }
  filters {
    // No direct subquery, so use aggregation logic
    // Approach: For each site, count how many of the required key/value pairs exist
    (
      count_distinct(
        case(
          when: (field_values.field_key == 'A1' and field_values.value == '123') or
          (field_values.field_key == 'A2' and field_values.value == '456') or ...,
          then: field_values.field_key
        )
      ) == 2
    )
  }
}
- Practicing this approach gains no beneficial value compared with running a normal SQL query against database:
SELECT
    wp.id,
    wp.name
FROM tblWorkPackage wp
JOIN tblCustomFieldValues cfv ON wp.id = cfv.entity_id
JOIN tblCustomFieldDefs cfd ON cfv.field_def_id = cfd.id
WHERE
    -- 1. List ALL conditions in an OR block
    (cfd.field_key = 'A1' AND cfv.value_number = 1) OR
    (cfd.field_key = 'A2' AND cfv.value_number = 2) OR
    (cfd.field_key = 'A3' AND cfv.value_number = 3)
GROUP BY
    wp.id, wp.name
HAVING
    -- Ensure the site matched exactly 3 distinct criteria
    COUNT(DISTINCT cfd.field_key) = 3;
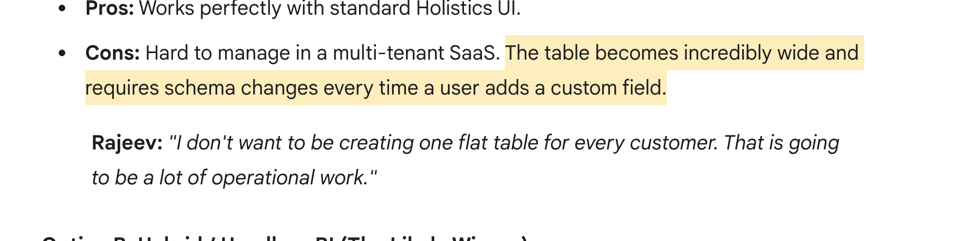
- Also, the BI tool does not support multi-tenancy on custom columns (while expectation is avoid flattening too many custom fields in a single table, maintain multi-tenancy and security standard).
- So the final assessment is Holistics may not be suitable for your use case. Because BI tools build on the assumption that the database column should be explicitly visible. In EAV, the columns are hidden as rows in Fields and Values tables.
- Based on requirements there are 3 main parts:
- “It may not be a good fit, it may not be a strong fit, whatever. But the point is, if you can’t support this guy, I don’t know if other tools can do it.”
DONE Write a note to #sales-demo to consolidate drill-through dashboards into one.
DONE Check Tricia’s question
DONE Move AI assets to a new repository